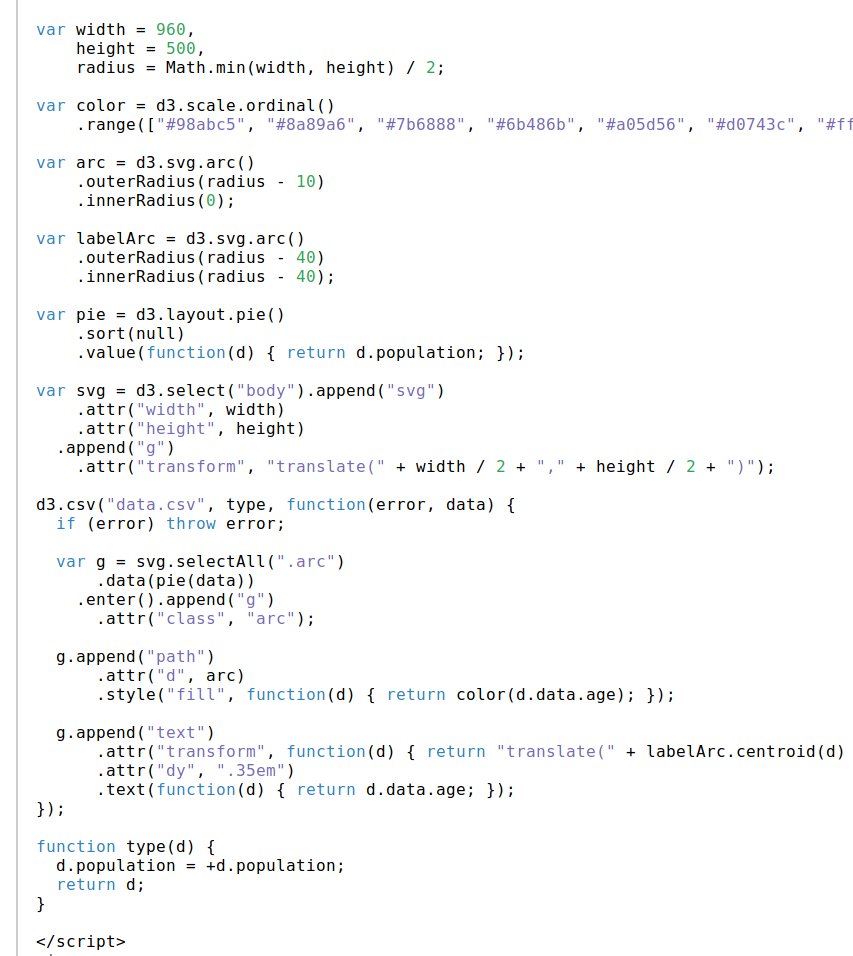
*2017:* look at these few lines of JS code to see how easy it is to make a pie chart in D3 https://t.co/puuIZGTYrK *2018:* data > Array(18) [Object, Object, Object,...] format > ƒ m(t) color > ƒ i(i) https://t.co/4ZkjFrhFPI https://t.co/V5OkYHXfbk
*2017:* look at these few lines of JS code to see how easy it is to make a pie chart in D3 https://t.co/puuIZGTYrK *2018:* data > Array(18) [Object, Object, Object,...] format > ƒ m(t) color > ƒ i(i) https://t.co/4ZkjFrhFPI https://t.co/V5OkYHXfbk