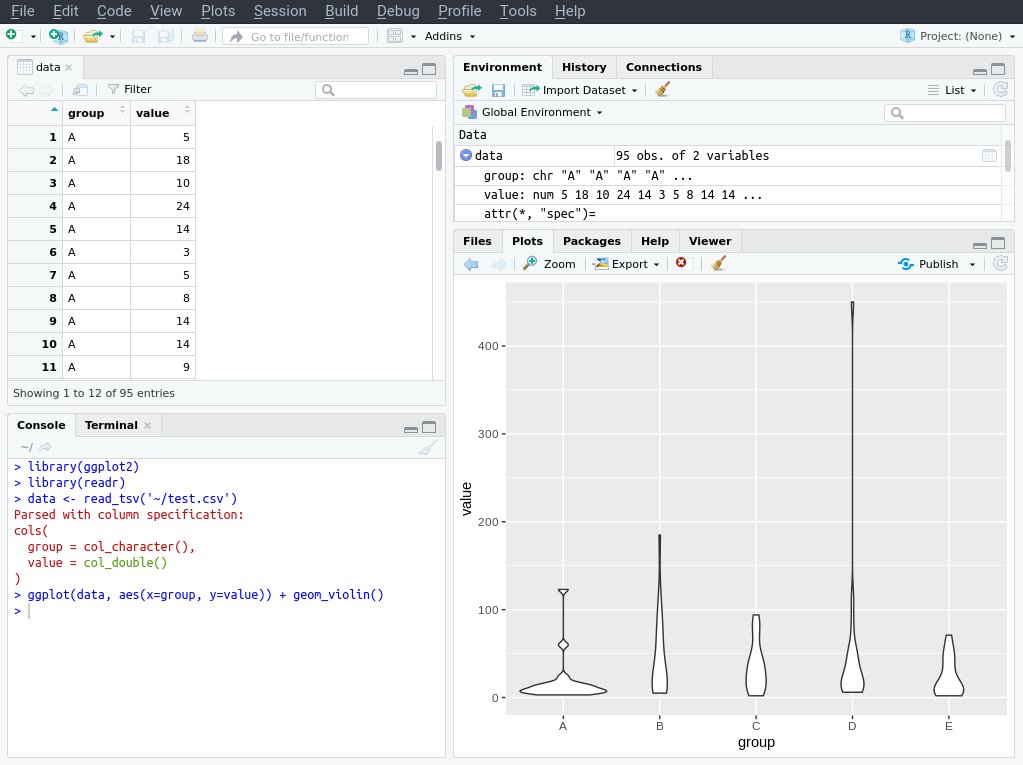
@brodiegal @albertocairo @visualisingdata I know you said *without* coding, but now's the time to learn it!!! In R it's literally just 4 lines of code. They even fits into the rest of this tweet! 😄 > library(readr) > library(ggplot2) > data <- read_tsv('~/test.csv') > ggplot(data, aes(x=group, y=value)) + geom_violin() https://t.co/P0wrT2caW8