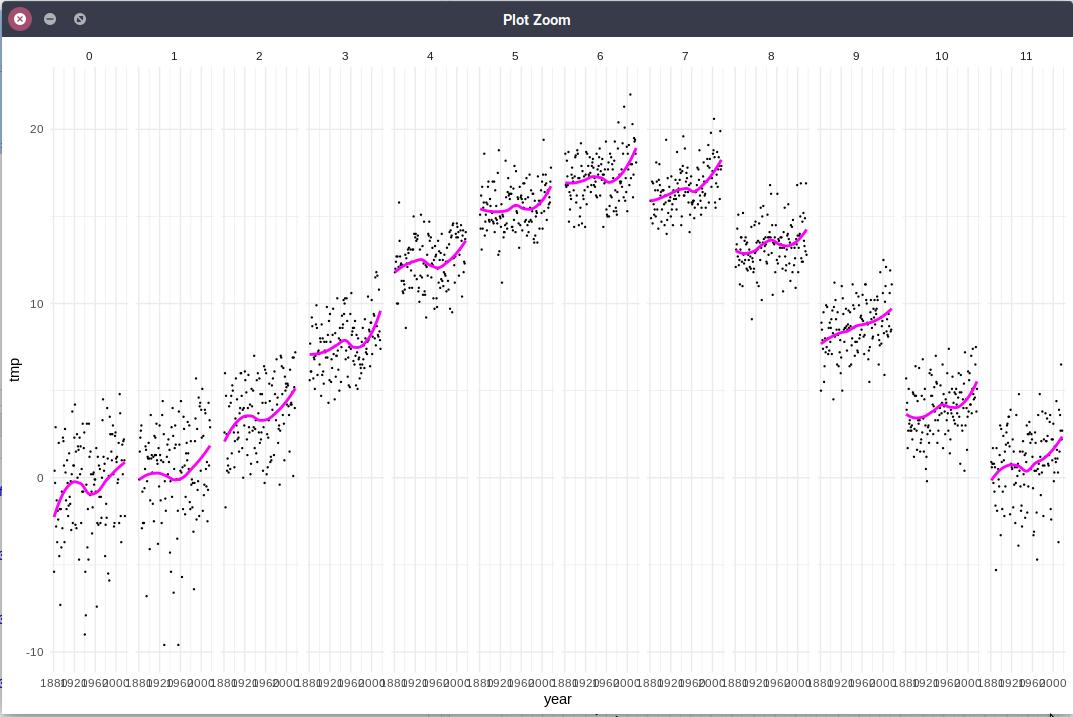
@samtherevelator @vikesh_koul here you go: library(readr) library(ggplot2) d <- read_csv('https://t.co/FRgg0HTxF7') ggplot(d, aes(x=year, y=tmp)) + geom_point(size=0.2) + facet_grid(. ~ month) + geom_smooth(method = "loess", size = 1, color='#ff00ff', se = F) + theme_minimal() https://t.co/BN6ORBs2VH