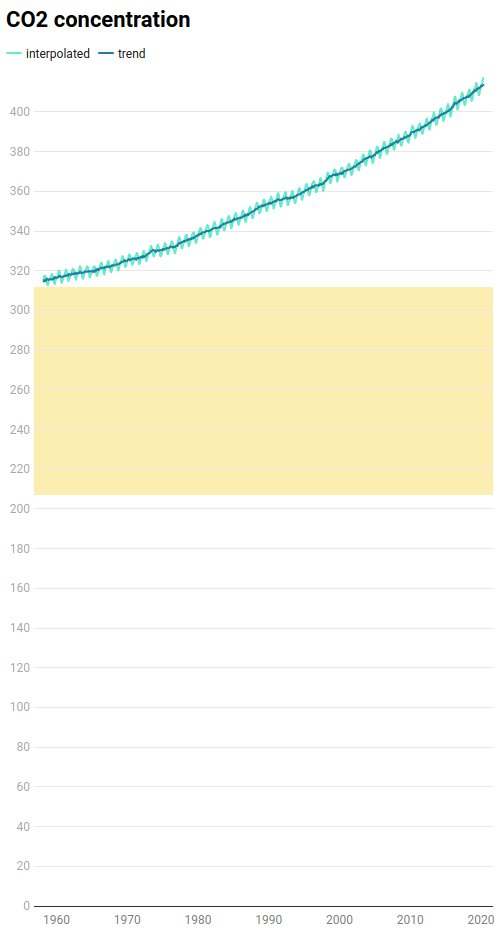
@chadskelton @AlbertoCairo @evergreendata @Datawrapper @tableau in other words, we extend to the zero baseline if at least 50% of the chart height is used by the line. For the CO2 concentration data, the zero baseline is far below that "yellow" area, so we're not extending the y axis. https://t.co/k1hvPBDN1c